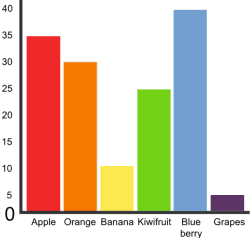
We are going to be collecting our own data and representing it in a bar graph with a suitable scale and appropriate titles and labels.
We will be investigating how changing the scale of the y-axis can change the appearance of the graph.
In addition, we will be using graphs and frequency charts to help present the answer to mathematical questions.
As part of this we will also be investigating the mode, range, mean and median of data.
To help you prepare or brush up on your skills here are some games. Enjoy!
http://www.bbc.co.uk/bitesize/ks2/maths/data/frequency_diagrams/play/popup.shtml
http://www.bbc.co.uk/bitesize/ks2/maths/data/mode_median_mean_range/play/popup.shtml


 RSS Feed